Check out our new Groundhog Day charts
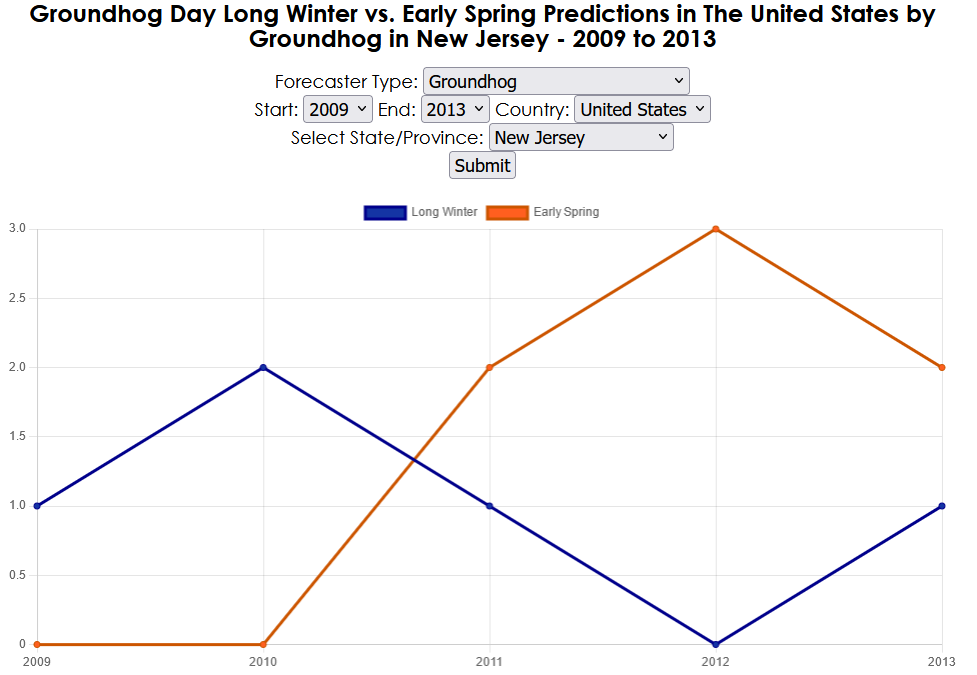
Have you ever wanted to quickly see what the groundhogs in New Jersey predicted from 2009 to 2013? Well now you can.

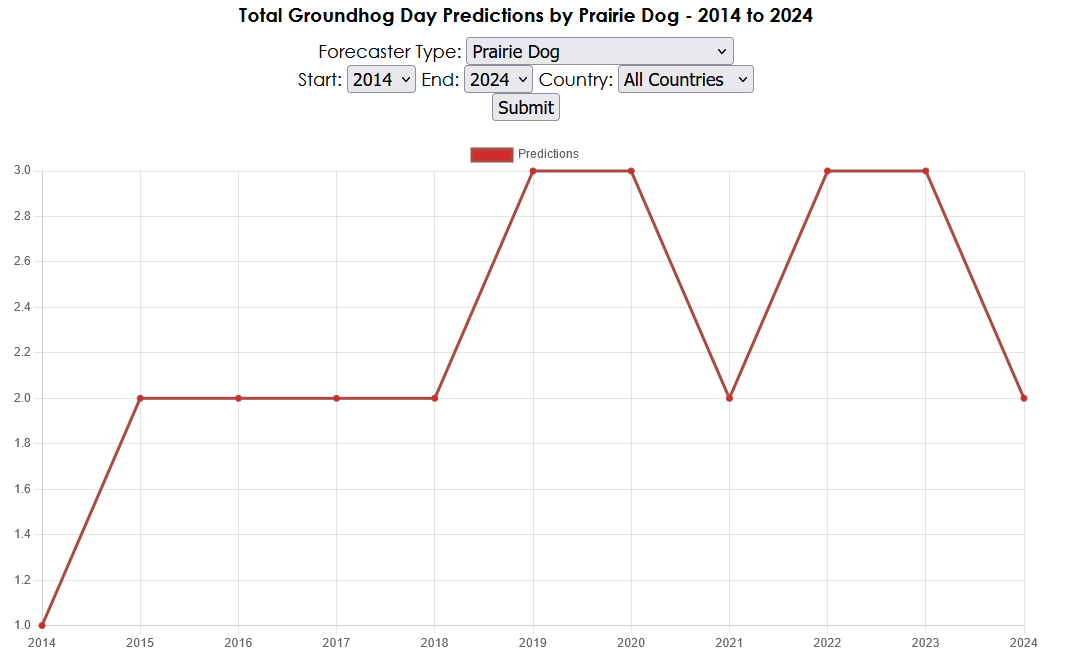
What about the total number of Groundhog Day predictions from from porcupines 2014 to 2024? You can see that too.

At Countdown to Groundhog Day, we’ve added graphical representations of our Groundhog Day forecaster and prediction data to the website. We’ve been continuing to research and add to our database of Groundhog Day forecasters and historical prediction data, and we wanted to make it easier for visitors to see trends in this data. As of now you can see the Total Number of Groundhog Day predictions, and Long Winter Vs. Spring predictions. You’re able to drill down based on forecaster types, country or state, in any range of years that we have predictions for.
We’ll continue adding to the types of charts that you can generate. If you have any ideas for charts or graphs you’d like to see, feel free to send us your recommendations.
Have fun, and enjoy!
Tags: groundhog day, groundhog day charts, groundhog day data, groundhog day graphs
